Today over coffee, a few of us were discussing the Gondola effect and some other muCap analysis things. I produced some napkins that people thought should be conveyed. I redraw the main idea below with an explanation here for you to try (or modify and try a related idea).
With Bernhard here, I understand better the Berkeley idea of the time-dependence of the physical frames of the TPC. For example, suppose a muon moves toward a shadow region as it diffuses in the gas (up or ud). If the corners are shadowed more as a function of time after muon stop, then a change in the lifetime will be observed. Basically, this is the sort of idea presented by Fred et al last time through and now I appreciate the idea. Bernhard is planning to MC this to see, but I propose a simple test one can do now using data.
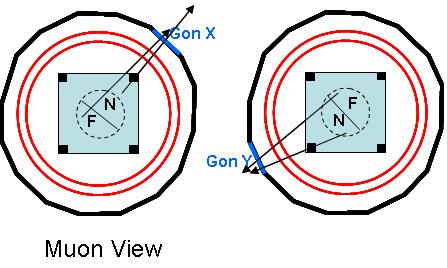
The idea is best understood by looking at this picture first. It is a muon's eye view of the TPC, ePC, gondolas. The hatched circles are not physical ... they roughly carve out the fiducial volume of stops in this view. I exaggerate the corners of the TPC frame in black. There are two pics, just to illustrate the point. Consider the one on the left first. For Gondola X, it can be hit by the sort of tracks I draw. I suggest dividing the stops in this x-y vies along a meridian that is parallel to the orientation of Gondola X, then defining each muon as either a Near-side (N) or Far-side (F) muon from the perspective of this strip. Then, plot the DIFFERENCE between the lifetimes of the N-F vs Gondola and, in fact, you can even collapse this by summing over all N-F pairs around the ring (The 2nd pic is included to illustrate how the N-F definition rotates for each Gondola strip hit on any given event.
The point of this should be clear. IF there is diffusion "toward" the Gondola, then the obstruction looks bigger than if the diffusion is "away" from the gondola. The method has the advantage of using the full statistics. All events are now included but we are doing a differential sorting.
I think you can probably build up these plots from the existing data rather quickly. Think about it and send along your thoughts.
Dave